Running Ansible Playbooks on Edge Devices
There may be cases in which you would like to be able to execute a scripts or commands in a device or on a group of devices. For example, in...
Read MorePublished on May 13, 2022 by Jordi Gil
Flotta exposes the workload logs in syslog format, the data is then captured by the device worker and sent to the appropiate log collector defined in the device. Metrics generated in the device are prometheus compatible format. These metrics are pushed in bulk to a configured endpoint in the device, usually being Thanos hosted in a cluster.
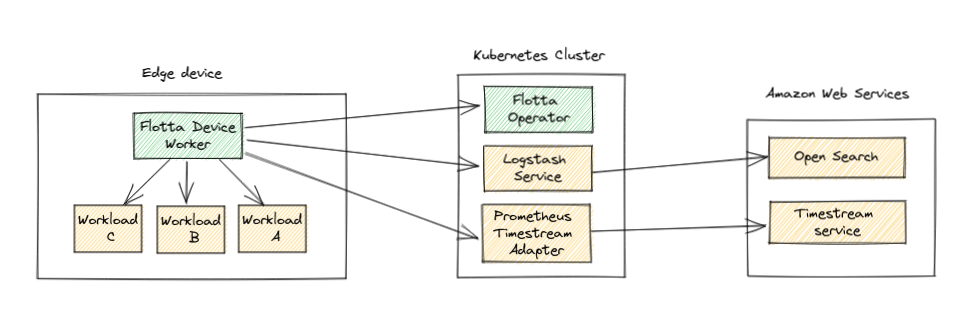
In this post we will see how to configure Flotta devices and workloads to send the logs and metrics generated to AWS, in particular to the Open Search service (or elasticsearch) and to the TimeStream service for storing metrics.
Flotta currently supports the syslog protocol as the default log format. In our case, we will use logtash as an intermediate entity to consolidate the logs from the workload and forward them to AWS’s elasticsearch service.
We’ll then proceed to deploy a logstash instance in our kubernetes cluster and expose the service’s endpoint outside the cluster. This last part is required to allow the flotta device worker to reach the service outside the cluster.
But first, we store the AWS service’s credentials for Open Search in a secret.
In order to authenticate against AWS’s service, we’ll need to create new credentials in the Open Search service. We’ll use logstash-secret as the given name with LOGSTASH_USERNAME and LOGSTASH_PASSWORD as the keys. These values are used by the logstash deployment later on.
apiVersion: v1
kind: Secret
metadata:
  name: logstash-secret
type: Opaque
data:
  LOGSTASH_PASSWORD: S0FEN3sv....
  LOGSTASH_USERNAME: am9343s...
With that, we are ready to deploy our logstash instance. Note the input configuration for syslog and the output to connect to AWS.
---
apiVersion: apps/v1
kind: Deployment
metadata:
  name: logstash-deployment
spec:
  replicas: 1
  selector:
    matchLabels:
      app: logstash
  template:
    metadata:
      labels:
        app: logstash
    spec:
      containers:
      - name: logstash
        env:
          - name: LOGSTASH_PASSWORD
            valueFrom:
              secretKeyRef:
                name: logstash-secret
                key: LOGSTASH_PASSWORD
          - name: LOGSTASH_USERNAME
            valueFrom:
              secretKeyRef:
                name: logstash-secret
                key: LOGSTASH_USERNAME

        image: docker.elastic.co/logstash/logstash-oss:7.7.1
        ports:
        - containerPort: 514
        volumeMounts:
          - name: config-volume
            mountPath: /usr/share/logstash/config
          - name: logstash-pipeline-volume
            mountPath: /usr/share/logstash/pipeline
        resources:
            limits:
              memory: "4Gi"
              cpu: "2500m"
            requests:
              memory: "4Gi"
              cpu: "800m"
      volumes:
      - name: config-volume
        configMap:
          name: logstash-configmap
          items:
            - key: logstash.yml
              path: logstash.yml
      - name: logstash-pipeline-volume
        configMap:
          name: logstash-configmap
          items:
            - key: logstash.conf
              path: logstash.conf
---
kind: Service
apiVersion: v1
metadata:
  name: logstash-service
spec:
  selector:
    app: logstash
  ports:
  - protocol: TCP
    port: 5140
    targetPort: 5140
    name: syslog
  type: ClusterIP
---
apiVersion: v1
kind: ConfigMap
metadata:
  name: logstash-configmap
data:
  logstash.yml: |
    http.host: "0.0.0.0"
    path.config: /usr/share/logstash/pipeline
  logstash.conf: |
    input {
      syslog {
        port => 5140
      }
    }
    output {
      elasticsearch {
        ilm_enabled => false
        hosts => ["https://search-project-flotta-lpfibcnqkcpgavdbprrueysk6a.us-east-1.es.amazonaws.com:443"]
        user => "\${LOGSTASH_USERNAME}"
        password => "\${LOGSTASH_PASSWORD}"
        index => "logstash-%{+YYYY.MM.dd}"
      }
    }
And we validate that the pod has successfully deployed:
$>kubectl get pod
NAME                                                        READY   STATUS    RESTARTS   AGE
logstash-deployment-7fc4567f6d-594xh                        1/1     Running   0          60s 0          1h
Finally, we manually expose the service via the port-forward command in kubectl. In a production environment, this should point to a public FQDN or IP accessible outside the cluster.
$> kubectl port-forward svc/logstash-service 5140 --address 0.0.0.0
Now that logstash is deployed and connected to AWS, we need to configure the edge device to expose the logstash collector. Following the details described in this blog post, we create the configmap and define the specification in the edge device:
apiVersion: v1
kind: ConfigMap
metadata:
  name: logstash-syslog
  namespace: default
data:
  Address: 192.168.1.134:5140
  Protocol: tcp
Here we use the cluster host’s IP where logstash is running. The service will be reachable thanks to the port-forward command previously executed on the cluster’s host.
Next is to update the EdgeDevice specification to expose the log collector. Here we define the log collector logstash-syslog with a maximum buffer size of 10mb.
spec:
  logCollection:
    logstash-syslog:
      bufferSize: 10
      kind: syslog
      syslogConfig:
        name: logstash-syslog
To instruct the workload to use the given log collector, we just have to define it as part of the manifest:
apiVersion: management.project-flotta.io/v1alpha1
kind: EdgeWorkload
metadata:
  name: random-workload
spec:
  logCollection: logstash-syslog
  deviceSelector:
    matchLabels:
      app: foo
  type: pod
  pod:
    spec:
      containers:
        - name: random-server
          image: docker.io/eloycoto/logexample
And with that, the logs will be sent to our backend in AWS. To confirm that it’s working fine, we query the service to list the contents of the index we defined in the configmap:
index => "logstash-%{+YYYY.MM.dd}"
Which, in this case it translates to logstash-2022.05.12:
username=$(oc get secret logstash-secret -o jsonpath='{.data.LOGSTASH_USERNAME}' | base64 -d)
password=$(oc get secret logstash-secret -o jsonpath='{.data.LOGSTASH_PASSWORD}' | base64 -d)
curl -u $username:$password -X GET "https://search-project-flotta-lpfibcnqkcpgavdbprrueysk6a.us-east-1.es.amazonaws.com:443/logstash-2022.05.12/_search?pretty=true" -H 'Content-Type: application/json' -d'
{
    "query": {
        "match_all": {}
    }
}
'
And we get a few results already, displaying the first one to reduce cluttery.
  "hits" : {
    "total" : {
      "value" : 1162,
      "relation" : "eq"
    },
    "max_score" : 1.0,
    "hits" : [
      {
        "_index" : "logstash-2022.05.12",
        "_type" : "_doc",
        "_id" : "z07vuYAB7aBvPfPHfBaK",
        "_score" : 1.0,
        "_source" : {
          "@version" : "1",
          "severity" : 0,
          "facility" : 0,
          "severity_label" : "Emergency",
          "@timestamp" : "2022-05-12T20:22:01.494Z",
          "host" : "127.0.0.1",
          "tags" : [
            "_grokparsefailure_sysloginput"
          ],
          "facility_label" : "kernel",
          "priority" : 0,
          "message" : "<6>2022-05-12T16:22:01-04:00  random-workload[3966]: dcc80a53ab7e5871f38e6b5184d785d58f5c698505fe74dd04597dcaac372c1b: New message at: Thu May 12 20:22:01 UTC 2022\n"
        }
      },
    ],
  }
Flotta collects metrics using the prometheus format. The information is pushed from the device back to a remote write entity configured in the device, usually a Thanos instance hosted in a cluster collecting all the metrics from all devices. AWS provides a time series database service named Timestream. This service is not compatible with the prometheus format, so in order to push the metrics we need an adapter that can transform the data in AWS format. That’s where the prometheus timestream adapter comes to save the day: This small application transforms the data in prometheus format to the DB format in the Timestream service, making it possible to push the device’s metrics to AWS and later on display them using Grafana.
But first, we need to configure the device with the service endpoint, metrics to push and the interval by adding these fields under the spec section:
spec:
  metrics:
    receiverConfiguration:
      url: http://project-flotta.io:9201/write
    system:
      allowList:
        name: system-allow-list
      interval: 5
The system-allow-list is a configmap that contains the metrics names to be pushed. For this demonstration, we’ll leverage on tree metrics from node exporter. Further information about metrics configuration can be found in the observability document. Let’s create a saple confimap containing 3 node exporter metrics:
apiVersion: v1
kind: ConfigMap
metadata:
  name: system-allow-list
data:
  metrics_list.yaml: |
    names:
      - node_disk_io_now
      - node_memory_Mapped_bytes
      - node_network_speed_bytes
The prometheus timestream adapter leverages on the aws credential and config files to authenticate against the Timestream service. For this example, we’ll create a secret named aws-credentials Note that the deployment expects to find the AWS credentials and configuration files under ~/.aws/.
kubectl create secret generic aws-credentials --from-file=config=$HOME/.aws/config --from-file=credentials=$HOME/.aws/credentials
We will use the following manifests to deploy the service in the cluster:
---
apiVersion: apps/v1
kind: Deployment
metadata:
  name: prometheus-timestream-adapter-deployment
spec:
  replicas: 1
  selector:
    matchLabels:
      app: prometheus-timestream-adapter
  template:
    metadata:
      labels:
        app: prometheus-timestream-adapter
    spec:
      containers:
      - name: adapter
        env:
          - name: AWS_CONFIG_FILE
            value: /var/mount/aws/config
          - name: AWS_SHARED_CREDENTIALS_FILE
            value: /var/mount/aws/credentials
          - name: AWS_REGION
            valueFrom:
              configMapKeyRef:
                name: prometheus-adapter
                key: awsRegion
          - name: DATABASE_NAME
            valueFrom:
              configMapKeyRef:
                name: prometheus-adapter
                key: databaseName
          - name: TABLE_NAME
            valueFrom:
              configMapKeyRef:
                name: prometheus-adapter
                key: tableName
        image: quay.io/jordigilh/prometheus-timestream-adapter:latest
        imagePullPolicy: IfNotPresent
        command: ["/usr/local/bin/prometheus-timestream-adapter"]
        args: ["--awsRegion","$(AWS_REGION)","--databaseName","$(DATABASE_NAME)","--tableName","$(TABLE_NAME)"]
        ports:
        - containerPort: 9201
        volumeMounts:
          - name: aws-credentials
            mountPath: /var/mount/aws
            readOnly: true
        resources:
            limits:
              memory: "512Mi"
              cpu: "500m"
            requests:
              memory: "512M"
              cpu: "500m"
      volumes:
      - name: aws-credentials
        secret:
          secretName: aws-credentials
          items:
            - key: credentials
              path: credentials
            - key: config
              path: config
---
kind: Service
apiVersion: v1
metadata:
  name: prometheus-timestream-adapter-service
spec:
  selector:
    app: prometheus-timestream-adapter
  ports:
  - protocol: TCP
    port: 9201
    targetPort: 9201
    name: adapter
  type: ClusterIP
---
apiVersion: v1
kind: ConfigMap
metadata:
  name: prometheus-adapter
data:
  awsRegion: us-east-1
  databaseName: flotta
  tableName: metrics
Note it contains a Deployment, Service and ConfigMap. The deployment mounts the aws credentials in /var/mount/aws and also exposes the ConfigMap values as part of the environment. We’ve parametrized the aws region, database name and table name values in the configmap to make it easier to customize the deployment.
$> kubectl get pod
NAME                                                       READY   STATUS    RESTARTS   AGE
logstash-deployment-7fc4567f6d-594xh                       1/1     Running   0          1h
prometheus-timestream-adapter-deployment-859f96565-s5zgp   1/1     Running   0          1h
Since the device is outside the cluster, again we’ll need to expose the new service by forwarding the port using the kubectl command. This would not be needed if the service was accessible directly by the device:
kubectl port-forward svc/prometheus-timestream-adapter-service 9201 --address 0.0.0.0
To validate that the metrics are being forwarded correctly, we can check the journaltcl logs from the device:
May 12 19:24:11 localhost-live yggdrasild[5344]: [yggdrasild] 2022/05/12 19:24:11 /usr/libexec/yggdrasil/device-worker: wrote metrics range 2022-05-12 19:19:05.275 -0400 EDT(1652397545275000000)-2022-05-12 19:24:05.276 -0400 EDT(1652397845276000000)
May 12 19:24:11 localhost-live yggdrasild[5344]: [yggdrasild] 2022/05/12 19:24:11 /usr/libexec/yggdrasil/device-worker: wrote metrics range 2022-05-12 19:24:05.277 -0400 EDT(1652397845277000000)-2022-05-12 19:24:10.273 -0400 EDT(1652397850273000000)
Or even better, query directly the metrics in the AWS Timestream service.
By leveraging on open source technologies, Flotta is able to integrate with AWS to collect device metrics and logs. This means you can deploy Flotta in AWS and make use of their services to monitor your stack of devices in one single place.
There may be cases in which you would like to be able to execute a scripts or commands in a device or on a group of devices. For example, in...
Read MoreEdge Example App is an app for Flotta Edge devices, with a workload that will be deployed on the device that has two main features: Sensing the Internet (which helps...
Read MoreEdge Example App is an app for Flotta Edge devices, with a workload that will be deployed on the device that has two main features:
Read More