Running Ansible Playbooks on Edge Devices
There may be cases in which you would like to be able to execute a scripts or commands in a device or on a group of devices. For example, in...
Read MorePublished on Sep 05, 2022 by Ahmad Ateya
Edge Example App is an app for Flotta Edge devices, with a workload that will be deployed on the device that has two main features:
Sensing the Internet (which helps to construct devices network topology). (see part 1 and part 2) Read CPU temperature (which indicate how much load the device is handling).<= this article
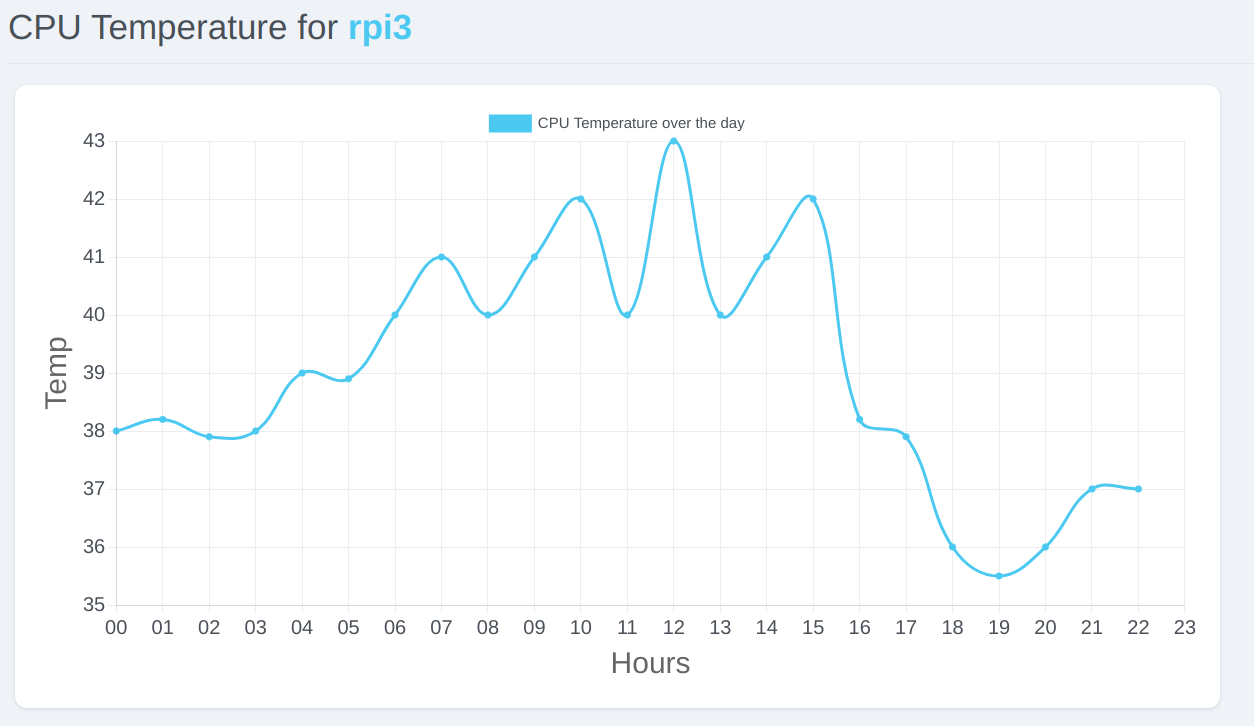
As Project Flotta goal is to manage workloads deployed on small-footprint devices, reading the CPU temperature is a good way to know how much load the device is handling. this App Along with the Web UI Interface, helps to collect and visualize the CPU temperature of the device over the day by presenting it as a Line Graph, making it easy to identify the time of the day when the device is handling more load.
This app reads the CPU temperature from the device and saves it to a file on the device, the device worker will send it to the edge cluster, and the edge cluster will save it to the S3 bucket (same synchronization mechanism used for the Internet sensing feature).
On the backend side, the edge cluster will read the file from the S3 bucket, calculate the average temperature for every hour and expose this data to the web UI with endpoints, which will present it to the user as a line graph.
2022/09/04 11:11:25 {"Temp":43}
2022/09/04 11:12:25 {"Temp":42.5}
2022/09/04 12:13:25 {"Temp":42.5}
2022/09/04 12:14:25 {"Temp":43}
2022/09/04 13:15:25 {"Temp":44}
This feature is part of the Edge Example App, so you can use the same manifests explained in part 1 to deploy the app to your device.
There may be cases in which you would like to be able to execute a scripts or commands in a device or on a group of devices. For example, in...
Read MoreEdge Example App is an app for Flotta Edge devices, with a workload that will be deployed on the device that has two main features: Sensing the Internet (which helps...
Read MoreEdge Example App is an app for Flotta Edge devices, with a workload that will be deployed on the device that has two main features:
Read More